The Chart of the Week series has consistently delivered accurate predictions, and the past two weeks’ focus on Aave and Sui is no exception. Both tokens moved as anticipated, allowing traders to hit profit targets and realize substantial gains.
Table of Contents
Aave smashes all 4 profit targets
From August 2 to August 5, Aave’s price action followed the pattern we predicted, hitting all four profit targets within just three days.

The $115 resistance level has a history of acting as a strong barrier for Aave. Our analysis suggested that this resistance would hold, and Aave would likely face a pullback. Traders who followed our guidance and entered a short position around the $115 mark saw major returns as Aave declined by -21.74%.

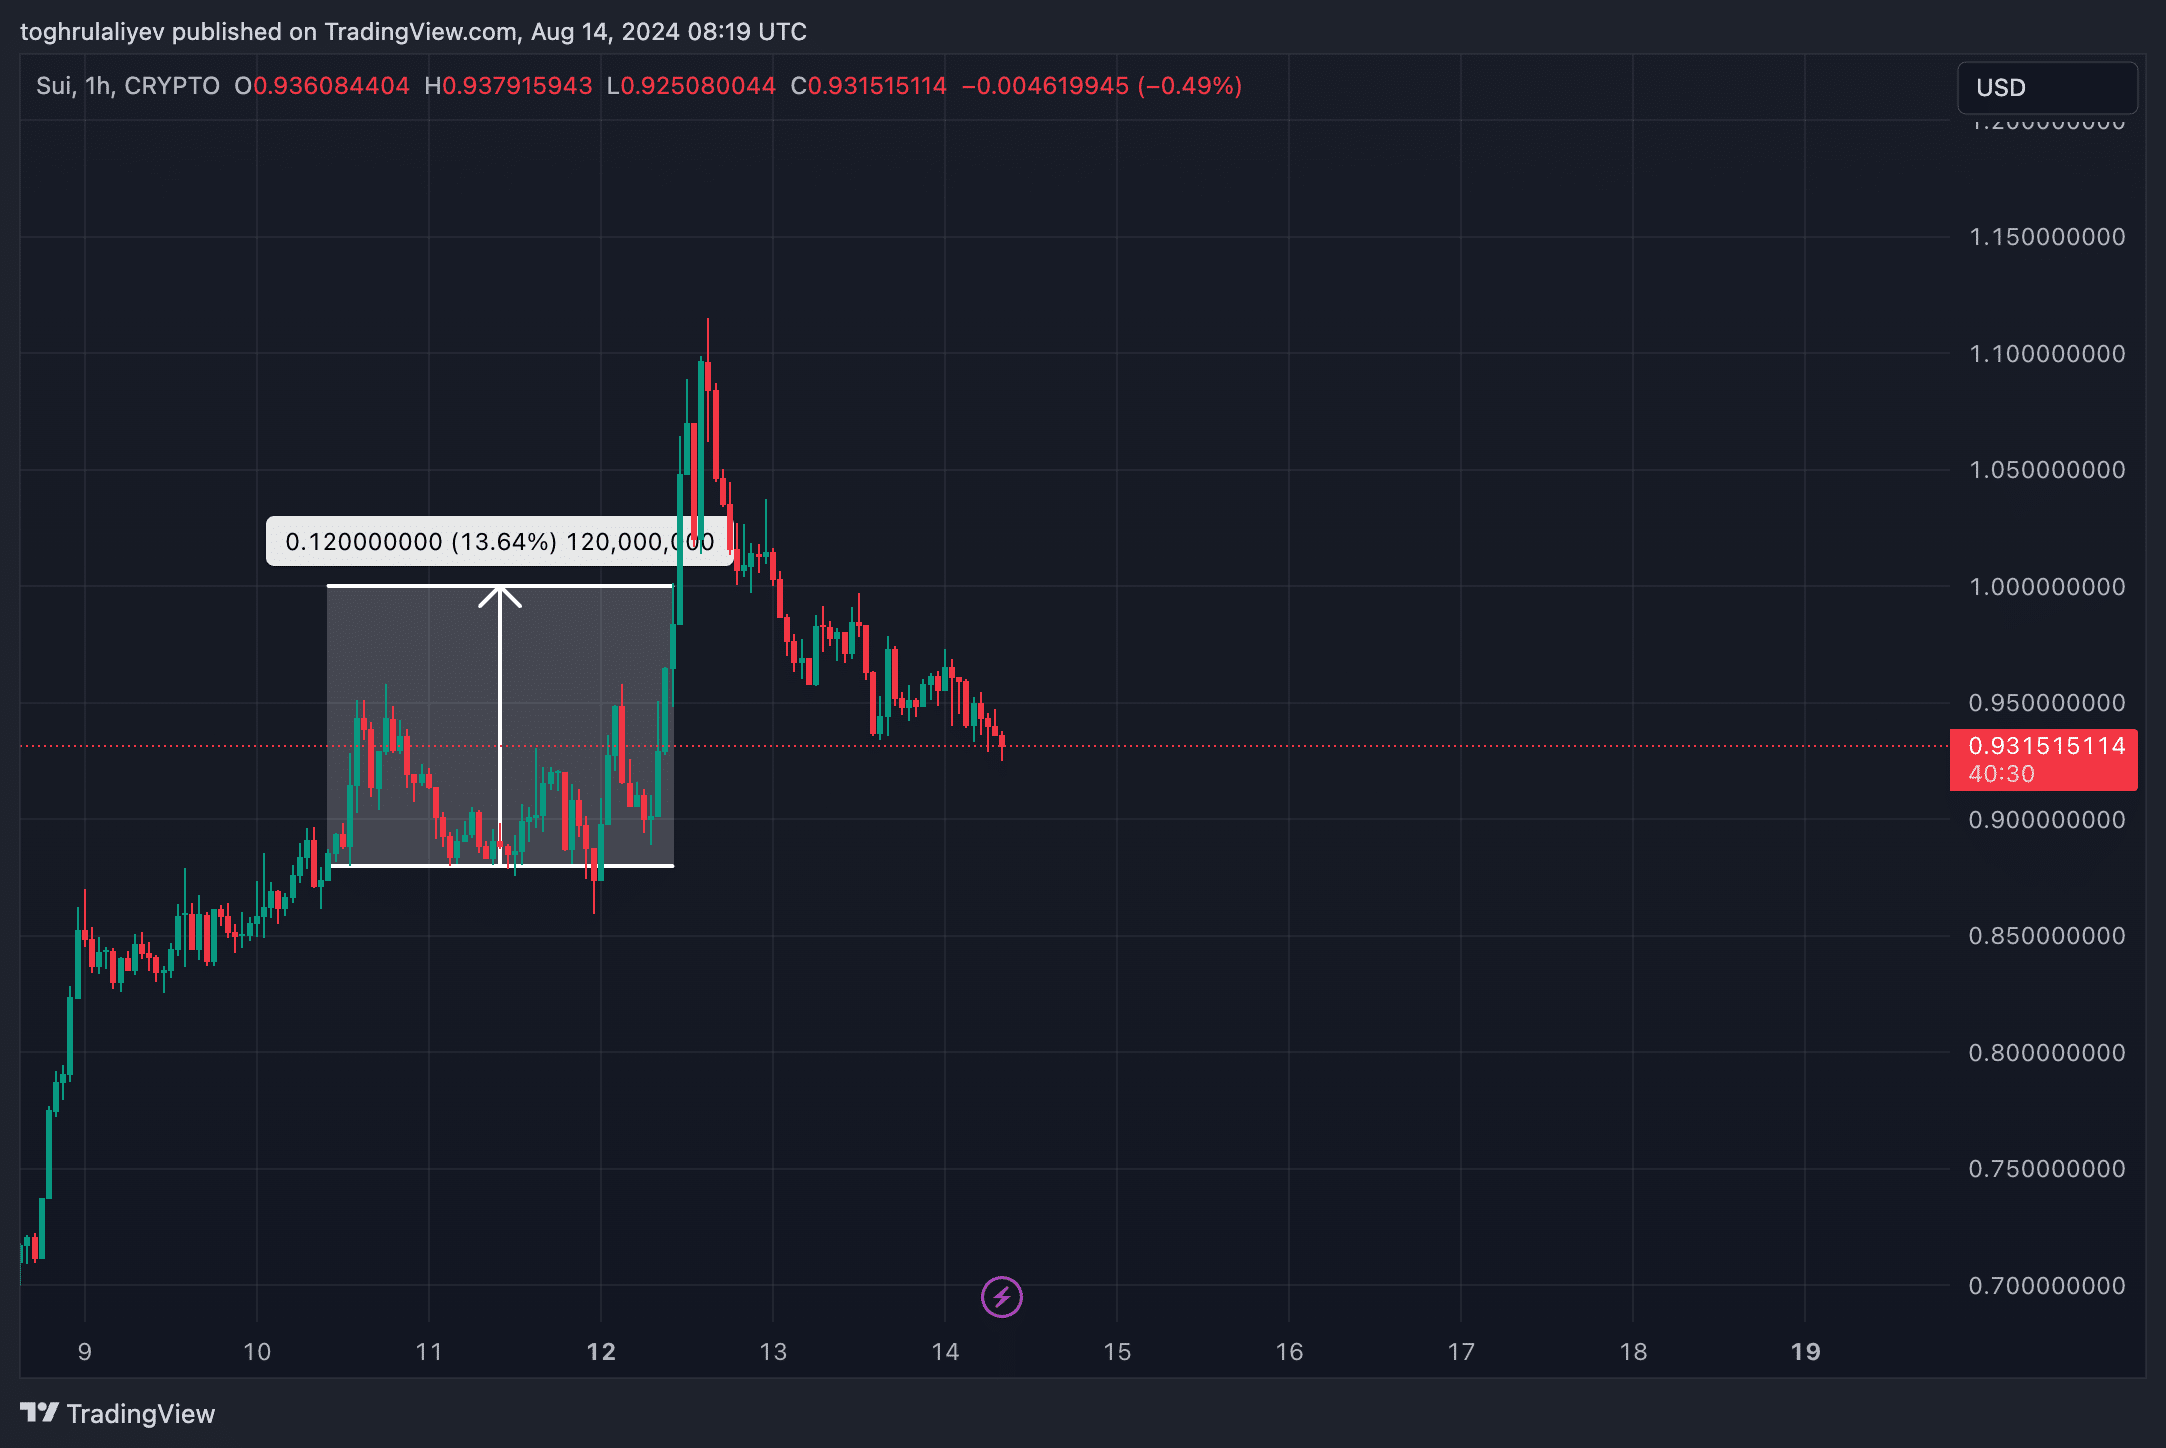
Sui Hits $1
Sui presented a different opportunity, with our analysis identifying a potential for upward movement. For traders who followed our advice and used the hourly chart to time their entry, an optimal position could have been taken around 10:00 AM UTC on August 10 at $0.88.

Again, by Monday, in just three days, the price action hit both profit targets at $0.9271 and $1.00, resulting in a 13.64% gain for those who exited at the second target.

Conclusion
The effectiveness of the Chart of the Week analysis will continue to manifest in the long term, but the prediction success rate currently stands at 92.31%, with 12 out of 13 trades being successful. Stay tuned for future analysis each Friday.
Tổng hợp và chỉnh sửa: ThS Phạm Mạnh Cường
Theo Crypto News
